OS X Built-in Security – Activity Monitor (OS X 10.9 Mavericks)
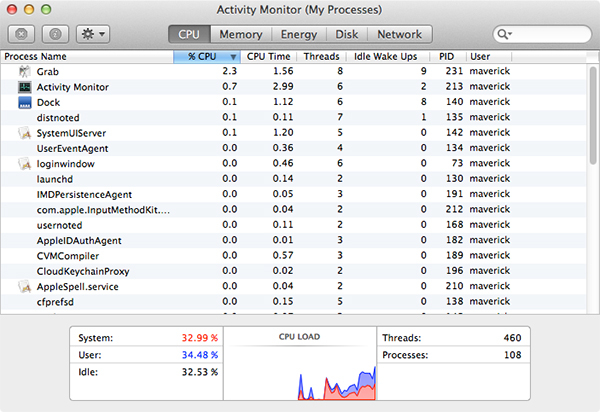
I have covered Activity Monitor before in an article you can find here but Apple has completely redesigned the utility in Mavericks so a new article was in order. It is still not a security tool per se but it can help you identify processes that really should not be there. Opening Activity Monitor for the first time you’ll be looking at something like this:
Before I go into this any further, let’s configure Activity Monitor so it’ll show us the most useful information. To do this, go to the View menu and set the following:
• Update Frequency > Very often (1sec) – This will give us a more real-time view of what’s going on.
• Check “All Processes” (default set to “My Processes”) – This will show us évery process running on the Mac including the ones that are opened by the system.
That’s a good start but there are a few columns in that window by dealt that are really not all that useful (and/or I have never found a good use for them). Go back to the View menu and bale only the following columns: % CPU, Threads, Real Memory, Sandbox, Sudden Termination and User. Now instead of going crazy and adding every column available to get as much information as possible, notice that Activity Monitor shows different tabs for different things. CPU, Memory, Energy etc. So there is no need to have the CPU window show us memory, energy or network related information. I use the CPU tab as a quick overview with the previously mentioned tabs enabled:
• % CPU – Will show you how much of your processor is being used by a process. While 100% used to be the limit, with the introduction of dual-processor and multi-core Macs it is not unusual to see a process take up 400% or more, depending on your configuration. If you run an application that relies on processor power you want that application to use as many cores as possible so it performs faster. It is important to know which processes are ok and allowed to do this and which are not. For example if you see the Finder process taking up all available processor power then something is most likely wrong as this process rarely takes up any noticeable power. By observing Activity Monitor for a while with the focus on CPU usage you can learn a lot about how certain applications behave.
• Threads – This shows how many instructions a process is currently performing. more threads = a busier process.
• Real Memory – This column shows how much physical RAM (memory) is a process using.
• Sandbox – Here you can see if an application or process is running in it’s own sandboxed environment. Processes like Adobe Flash and Java are two things you absolutely want to have run in a sandbox. This means that they are restricted to their own little environment and can not interact with the rest of the system. This way if a process or application is compromised (like is often the case with Flash and Java) the damage is limited to that sandbox. If you use a browser that calls on any potentially dangerous plugins without sandboxing them, you may want to consider using a different browser.
• Sudden Termination – This is a flag used by the system so it knows which processes can be quit immediately and without loss of data if resources are needed. It can help you for that same reason. Running low on memory or experiencing performance issues, you can quit a process that takes up a lot of memory if it shows ‘Yes’ in the Sudden termination column. Keep in mind that a process can only be in this state if it is using 0% processing power (it’s idle) and don’t close out random processes either, know what something is and does before you close it out.
• User – This will show you if an application or process is running with your permission (shows your user name) or if the system opened it (shows as root, mostly). There will be users listed that are also part of the system yet do not show root, this is normal and nothing to worry about. Users like _softwareupdate or _coreaudiod are common. If you have any doubts, do some research and see if that user is part of the system or not.
You can enable any columns you want of course depending on your needs but it is easy to get confused by too much information so keep it light. Now that Activity Monitor is configured we can explore the interface.
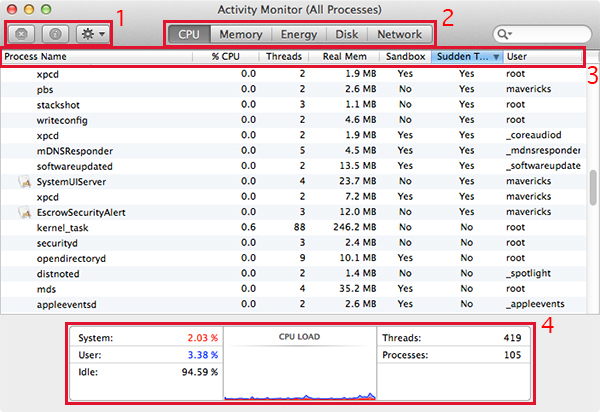
1. The top left corner shows buttons that allow you to quit a selected process, inspect it or sample it.
Quit Process – Manually quitting a process can be useful if it has become unresponsive. A process can be an application, plug-in or background process. It can be something you installed or part of OS X or one of it’s applications. For example ‘CalendarAgent’ is in charge of syncing my Calendar.app and online calendars. It’s not something i installed or something i can see but as part of OS X’s Calendar application it is there. Use this button as a last resort as using it could discard unsaved state, or save state that doesn’t correctly reflect how the application would look had you Quit it through the menu or Command-Q.
Inspect – To find out more about a process you can click the Inspect button, this will open a new window that can tell you about it’s memory use, statistics on it’s processor use and which files and ports it is connected to. The ‘open files and ports’ tab can be particularly useful if you need to open a specific port in your firewall for a service but don’t know which one.
Dropdown menu options:
Sample Process – If a process is causing/having issues frequently you can sample it, taking a snapshot of the code at that time. This sample can be saved and sent to a developer or posted on a forum so more experienced users can assist in troubleshooting. You won’t need this unless you want to analyze a process yourself or someone asks you for it.
Run Spindump – This takes a snapshot of every running process on the entire system and allows you to save it to a log file. I doubt you’ll ever need this unless you are into advanced troubleshooting.
Run System Diagnostics – This will generate a file that includes a whole lot of information that is relevant to someone that is well versed in troubleshooting and diagnostics. Read the pop-up that shows when selecting this option. Again, not something you’ll need unless Apple Support or your IT support asks for it. Do not give this data out to anyone unless you know or trust them.
2. These tabs are pretty self explanatory. Different tabs show information relevant to that topic and you can customize each of them to show the columns that you want just like you did in the CPU panel earlier. The bottom of the window will also change with each tab, more on this in point 4.
3. The columns can be re-arranged to make the information easier to understand. Grab and drag them left or right to find the best layout for you. Most relevant (to you) information first for example. Sounds irrelevant but how the information is presented to you can make a big difference.
4. The bottom of the Activity Monitor window is a summary and graphic representation of all information combined. This changes with each tab. Switching from CPU to Memory and so on you’ll see the following summaries:
CPU
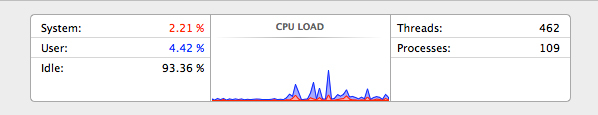
If all you need is just to see how busy your processor is, the summary is all you need. Do not be alarmed by the red text and red graph, the system using resources is nothing bad, red and blue are just easy to distinguish colors.
Memory (RAM)
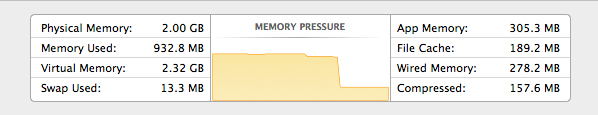
One of the differences here is the absence of “Free memory”. This statistic is no longer needed as it does not really matter (and if it does some simple math can tell you how much free memory you have).
Physical Memory – This is how much RAM you have installed in your system.
Memory Used – How much of that physical RAM is actually in use.
Virtual Memory – is a memory management technique that allows the system to use the available Physical RAM more efficiently. VM size is the total amount of virtual memory space reserved by the OS X and your apps. The actual amount of virtual memory being used is likely to be much less, because OS X and apps frequently reserve virtual memory space that they don’t use. This is Virtual memory, not real memory, so don’t be concerned if this number is very high.
Swap Used – Unlike the Virtual Memory size, this number is important as it represents the amount of hard drive space that is currently being used as virtual memory. Page outs cause swaps from the memory to the hard drive, these swaps are stored and are labeled ‘virtual memory’. Ideally this number will also show 0 but if you notice a big number (combined with a lot of page outs) add more RAM to your Mac if possible. Swapping can slow down your Mac’s performance. A restart will fix this but only until OS X runs out of RAM again.
Memory Pressure – This graph will also tell you everything you need to know at a glance. The height of the graph is not as important as the color indication.
Green = RAM is available
Amber = RAM is being tasked / running low. This is when compression usually starts happening to free up more. Memory compression is explained here.
Red = Out of RAM. Can’t compress any more so moved on to using the hard drive (swap files).
App Memory – The sum of all applications combined and their memory use. I believe this is only for applications you have opened and processes are not included but at the rime of writing I am not entirely sure.
File Cache – Reserved memory that is available to be purged. Mavericks will use whatever cached memory it can before moving on to compression.
Wired Memory – Information stored in the RAM by OS X, it’s kernel and other key components. This information is critical to the system and will always reside in the memory. It can’t be moved or deleted and is needed for good system performance. OS X will see how much total RAM you have and allocates a chunk of it. A system with more physical RAM will see a larger chunk of Wired memory.
Compressed – Mavericks can compress memory that is currently in use and free up a little bit more if needed. This new feature is especially useful on systems with little RAM (2 or 4 GB). Compression and decompression is done on the fly.
Energy
This can look different depending on your hardware. For desktop systems you’ll see this:

On a laptop you’ll see more though, like this:
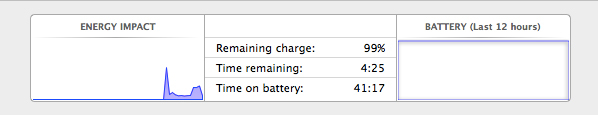
I believe these stats require no further explanation but the numbers above the summary can be a bit confusing. I’ll circle back to that later.
Disk
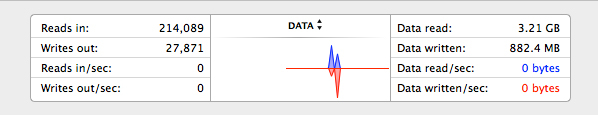
These statistics have never had too much value for me but they may have useful information for you. It basically allows you to see hard drive (or solid state drive) activity like how much was read and written, see the read and write speed (useful if you are testing performance) and a pretty graph to go along with it.
Network
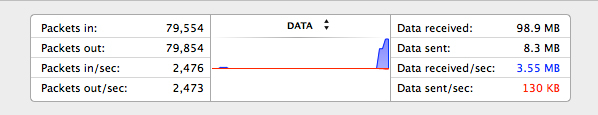
How much data was sent and received since you booted up your Mac, the current speed of upload and download and of course a graph!
Now let’s go back to the Energy tab and see what all those numbers are about.
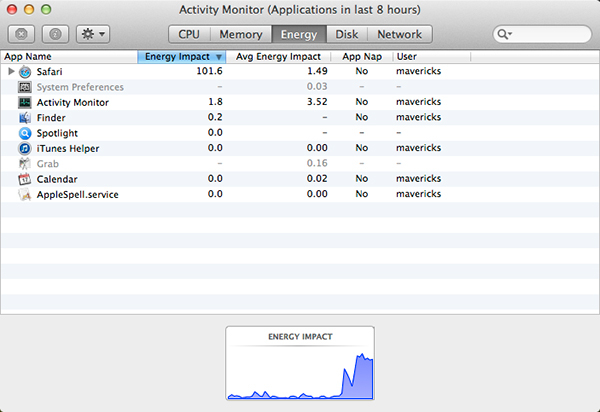
Safari has a big number under energy impact but what is it? It’s not a percentage, this number is relative. It simply means that 0.0 is using no energy and you can go up from there. So while 101.6 seems troublesome it is not, it just shows you that Safari is currently the biggest energy hog. While 0.0 is the minimum, 100 is not the maximum. You can see numbers go well above 100. I have seen VMWare do 356 or more, again this just means the application is using a lot of juice. This is not something to worry about on a desktop Mac but these statistics are important on a laptop where battery life is an issue. You can identify which applications or processes are draining your battery and act on it. The view for this tab is set to show you the last 8 hours but if you want a more complete list then go to the View menu and set it to “All Processes”.
All this takes care of the main window but there is more to Activity Monitor, some of it you’ve already explored. The menus. There are only two menu options that are of any use, the View menu and the Window menu. The View menu will let you set a sort order of all the processes and configure how you want the Dock icon to behave. I have this set to show network usage though I do not find it as useful as the icon and graph used in OS X versions prior to Mavericks. Play around with it and see which one you like best, if any. The dock icon will stay visible and active even if you close the main Activity Monitor window.
The Window menu allows you to pull up two more windows though they have no real use especially on machines with a lot of processor cores. CPU Usage pulls up a window showing real time activity on all processor cores, it takes up a lot more space than it did in previous versions of Activity Monitor and is therefore pretty much useless as it is hard to justify taking up this much screen space unless you really need it. For those of us that just like to monitor CPU use and used this window in the past it may now no longer be practical. Maybe on a Mac with 4 cores or less but for example a 12-core machine you’ll see this:

CPU History will pull up an even bigger window that shows you the history for each processor core. It only shows you the last few minutes and takes up a huge amount of space. I do not see a good use for this window due to it’s limited history and size.
Most of the Activity Monitor features can be used to spot and track down malware/spyware/adware as well as these can take up a good chunk of CPU power, disk read and/or network activity. If you spot a process you want to know more about, highlight it in the list with a single click and then click the Inspect button. This window has a useful tab in it called “Open Files and Ports” which will tell you exactly where to find all the files in use by that process. Here is an example of the open files and ports from Abk, a keylogger:
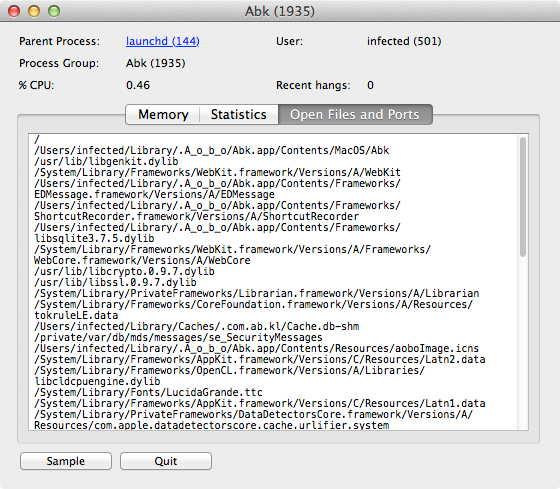
This list, among many other things, shows you that the keylogger gets a lot from it’s files from an invisible folder in the Library folder (.A_o_b_o). Most of the antivirus solutions out there that can detect this particular keylogger don’t even find this folder! Activity Monitor to the rescue. You can use this information to manually erase all traces of a process or application. I inspect the list of running processes regularly to make sure nothing is installed that should not be there. I have become familiar with the commonly used process names and know when something sticks out, what I don’t know is easily found online.
Do you use Activity Monitor? If so, what for? Let us know in the comments.
Do you find that you’re missing the simplicity of the previous Activity Monitor? I loved the simple graph / chart for memory, the network activity was more useful, etc? I’m not a fan of the changes – I wish I could still use the previous layout of information.
This may seem quite simple, but when I try and open Activity Monitor I am told it is not compatible because I have version 10.6. There does not seem, however, to be an option to upgrade. Any thoughts?
Thanks,
Cliff
Do you have older system files on your Mac? If your Mac has gotten uprades and has old System and Application folders on your drive it may be confused as to which version it’s opening. Check the root of your Macintosh HD, it should have Applications, Library, System and User folders, anything else should not be there like “System (old)” etc. After some cleaning try repairing the disk permissions with Disk Utility, then restart and try again.