OS X Built-in Security (5) – Activity Monitor

There are no settings you can change to enhance the security of your Mac but it is (one of the) great built-in tools for monitoring your system. You can find Activity Monitor in your Applications > Utilities folder and when you first open it, it really doesn’t look like much but if you know how to use the application it can help you in security related matters. (A OS X Mavericks version of this article can be found here)
Let’s go over the basics.
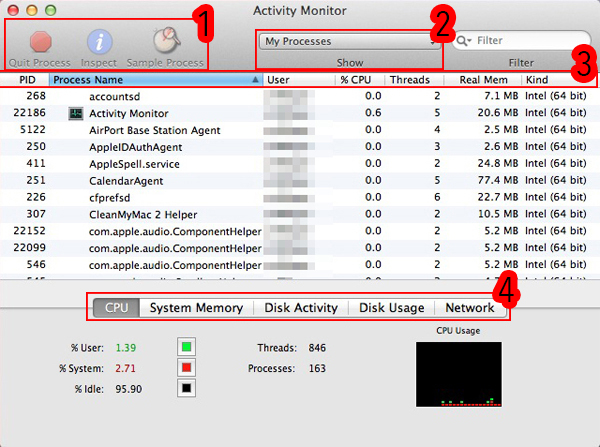
1. The top left corner shows buttons that allow you to quit a selected process, inspect it or sample it.
Quit Process – Manually quitting a process can be useful if it has become unresponsive. A process can be an application, plug-in or background process. It can be something you installed or part of OS X or one of it’s applications. For example ‘CalendarAgent’ is in charge of syncing my Calendar.app and online calendars. It’s not something i installed or something i can see but as part of OS X’s Calendar application it is there. Use this button as a last resort as using it could discard unsaved state, or save state that doesn’t correctly reflect how the application would look had you Quit it through the menu or Command-Q.
Inspect – To find out more about a process you can click the Inspect button, this will open a new window that can tell you about it’s memory use, statistics on it’s processor use and which files and ports it is connected to. The ‘open files and ports’ tab can be particularly useful if you need to open a specific port in your firewall for a service but don’t know which one.
Sample Process – If a process is causing/having issues frequently you can sample it, taking a snapshot of the code at that time. This sample can be saved and sent to a developer or posted on a forum so more experienced users can assist in troubleshooting. You won’t need this unless you want to analyze a process yourself or someone asks you for it.
2. A small drop down menu is set to ‘My Processes’ by default and this will only show processes that are called on by you (your user account). Clicking on this menu will show a few more options, to see every process set this to ‘All Processes’. I leave it set to show all processes so i can see everything that’s going on.
3. By default Activity Monitor will show a few columns. PID, Process Name, User, % CPU, Threads, Real Mem, Kind.
PID – The Process IDentification number. This is assigned by OS X i believe and as far as i know, does not serve a purpose for us.
Process Name – You guessed it.
User – This will show your username or ‘root’. Root is the user OS X identifies itself with. There are many more users you won’t recognize but that’s normal.
% CPU – Will show you how much of your processor is being used by a process. While 100% used to be the limit, with the introduction of dual-processor and multi-core Macs it is not unusual to see a process take up 400% or more, depending on your configuration. If you run an application that relies on processor power you want that application to use as many cores as possible so it performs faster. It is important to know which processes are ok and allowed to do this and which are not. For example if you see the earlier mentioned ‘CalendarAgent’ process taking up all available processor power then something is most likely wrong. By observing Activity Monitor for a while with the focus on CPU usage you can learn a lot about how certain applications behave.
Threads – This shows how many instructions a process is currently performing. more threads = a busier process.
Real Mem – This column shows how much physical RAM (memory) is a process using.
Kind – This will show if a process is Intel, Intel (64 bit) or PowerPC. If your Mac is a G4 or G5 all processes will be listed as ‘PowerPC’, If your Mac has an Intel processor but your version of OS X is 10.4 Tiger, 10.5 Leopard or 10.6 Snow Leopard, you may see a mix of all kinds and if you have a Mac with Intel processor running OS X 10.7 Lion or 10.8 Mountain Lion (and soon 10.9 Mavericks) then you’ll only see ‘Intel’ or ‘Intel (64 bit)’.
4. The tabs at the bottom of the window will show basic information, enough to give you a quick overview of those particular system components. These are the tabs you will use most often unless your focus is one specific process and not overall system performance. While mostly straight forward i’ll cover each of them.
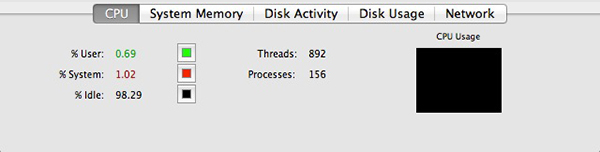
The CPU tab will show you how busy your processor is and who is causing the load. For details you have to refer to the list of processes. % User shows how much of the processor is being used by processes you or your user account have initiated. % System shows how much of the processor is being used by processes that the system (OS X) has initiated. % Idle shows how much of the processor is currently not being used. The Threads count is just the total number of threads currently active and the same goes for Processes. The box on the right shows the processor usage in a graph with the same color coding used by the numbers (you can change this by clicking on the colored squares). Use this window as a quick reference and if you notice unusually high processor usage, sort the list of processes by CPU use (click on the ‘% CPU’ column) to see what is causing your Mac to work so hard.
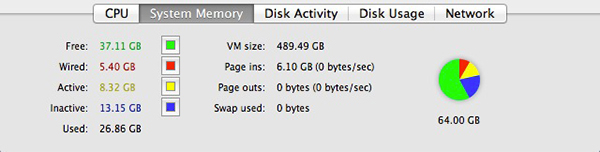
If your Mac is slow, applications take a while to open and/or you get memory warnings, check out the System memory tab. The pie chart will quickly show you if these issues are caused by not having enough available (free) memory (Physical RAM).
Free – The amount of memory still available.
Wired – Information stored in the RAM by OS X, it’s kernel and other key components. This information is critical to the system and will always reside in the memory. It can’t be moved or deleted and is needed for good system performance. OS X will see how much total RAM you have and allocates a chunk of it. A system with more physical RAM will see a larger chunk of Wired memory.
Active – Information currently in use or very recently used by a process. More applications running means a higher number of Active memory.
Inactive – Information that was recently used by a process is being kept in the memory for fast and easy access in case it is needed again on short notice. If another process needs more memory and no free memory is available, it will take back what it needs from the inactive memory. If you quit Mail while it still has information stored in the inactive memory, Mail will start up faster. If Mail’s information has already been kicked out of the inactive memory by another process it will take a little longer for Mail to start just like after a restart because it has to load it’s information from the hard drive rather than the (faster) memory.
Used – Total memory being used by all of the above combined.
VM size – Virtual Memory (VM) is a memory management technique that allows the system to use the available Physical RAM more efficiently. VM size is the total amount of virtual memory space reserved by the OS X and your apps. The actual amount of virtual memory being used is likely to be much less, because OS X and apps frequently reserve virtual memory space that they don’t use. This is Virtual memory, not real memory, so don’t be concerned if this number is very high.
Page ins – Shows how much information has been moved from your hard drive to the memory. This number is cumulative so will keep growing until you restart your Mac. Size is not an issue. The information between brackets show the speed at which the information was moved from the hard drive to the memory.
Page outs – The opposite of page ins, how much information was transferred from the memory to the hard drive. Ideally this number is always 0. Page outs occur when OS X runs out of physical memory and is forced to move some of it’s information to the hard drive for temporary storage. As your hard drive is much slower than the RAM page outs are usually accompanied by system slowdowns. Adding more RAM to your Mac ensures less page outs are needed or maybe none at all depending on how much RAM you add and how much is needed by OS X.
Swap used – Unlike the VM size, this number is important as it represents the amount of hard drive space that is currently being used as virtual memory. Page outs cause swaps from the memory to the hard drive, these swaps are stored and are labeled ‘virtual memory’. Ideally this number will also show 0 but if you notice a big number (combined with a lot of page outs) add more RAM to your Mac if possible. Swapping can slow down your Mac’s performance. A restart will fix this but only until OS X runs out of RAM again.
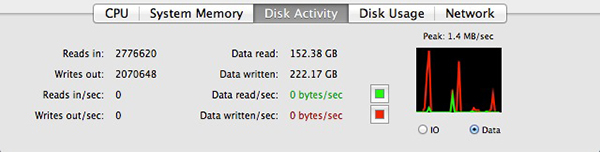
I have never had a need for the Disk Activity tab but i’m sure it can be useful in some scenarios. The information is pretty self explanatory. You may want to keep an eye on this tab when you are performance testing a hard drive or moving data from one drive to another.
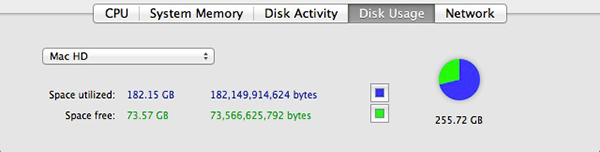
Disk Usage is a bit more useful as it shows how much space is used/available on every partition inside your Mac.
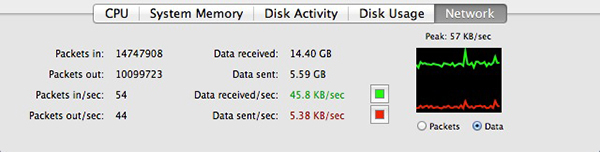
If you want the basic performance of your network, this is the place to be. I never pay much attention to the left column but use the center column often to test network throughput. If file transfers on a local network are slower than they should be or you want to verify how much data was sent since you booted your Mac (see if someone was accessing and copying your data without you knowing?) then this tab can be of help.
That covered the main window. Now let’s configure Activity Monitor to get a bit more info and speed out of it.
First, go to the View menu and set the Update Frequency to ‘Very Often’. This will give you a real-time view of what’s happening rather than a snapshot every few seconds. This can make a big difference when you are troubleshooting. As mentioned before, click on the ‘% CPU’ column to sort all processes based on how much processor power they are using (click the column header twice if you want it sorted the other way around). Now make the Activity Monitor window a little bigger so you can see more columns and go back to the View menu > Columns. You see there is quite a bit more information you can get. I will cover just a few useful columns.
Sudden Termination – If an application has nothing to save or clean up when they quit, this will read ‘Yes’. This will cause an application to simply be killed (instant quit) by the system without delay if needed. This status can change though. If Mail is docked and currently not doing anything it’s Sudden Termination status will read ‘Yes’. As soon as it checks the servers for new Mail or is busy doing other tasks it will change it to ‘No’. The system (since 10.7 Lion) keeps an eye on this status in case it needs additional resources it can just kill off that process knowing no data or settings will be lost. It can help you if you want to use the earlier mentioned ‘Quit Process’ button.
Sandbox – Sandboxing is a very important feature and helps keep your system safe if an application or process becomes compromised (either by malicious intent or a programming flaw). It ensures that an application or process can not touch anything outside of it’s own ‘sandbox’ so if something goes wrong within that application it will not affect other components of your system. Use this column to see if sandboxing is enabled where it should be.
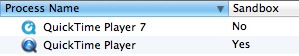 One example is QuickTime. The old QuickTime 7 is not a sandboxed application, the latest QuickTime 10 is. If the recently patched exploits would have been taken advantage of by someone with malicious intent, the sandbox could have aided in containing the damage the exploit could do.
Virtual Memory – To see how much Virtual Memory a process has reserved look at this column. As you can see the amount of VM a process has reserved far exceeds the amount of memory it is actually using (Real Memory column). This is just reserved in case it needs it and is not actually taking up that much hard drive space.
Apart from adding more columns you can also enable a floating CPU window that allows you to see real-time processor activity even if you’re in another app (Window menu > Floating CPU window) and you can set the Dock icon to display RAM usage or network usage (View menu > Dock Icon). I have also found the ‘Show Deltas for Process’ (View menu) but i don’t know much about it. From what i can tell, once enabled, it locks the current state and displays only the differences from that point on. I need to know more about this feature so if anyone knows just post it in the comments.
Now that you know your way around Activity Monitor, you can think of ways how it may be able to assist you in security related tasks. For example:
Use it to see if a process is taking up a lot of processing power, this may be a harmless process or it may be an indication a piece of spyware is logging and stealing your information in the background. Use the network view to see if something or someone is copying information from your machine without you knowing or maybe someone is monitoring you/watching your screen. Use it to see if something that should be sandboxed actually is. etc etc. If a suspect process is found just do a search online for the process name and see what you can find out about it. Even if not security related, it’s good to know your way around this app as it can be very helpful in a lot of scenarios.
Comments and feedback welcome.
2 thoughts on “OS X Built-in Security (5) – Activity Monitor”